Quick Facts
- Investment Performance: A $1,000 investment 20 years ago would have grown to approximately $2,900 today, including reinvested dividends.
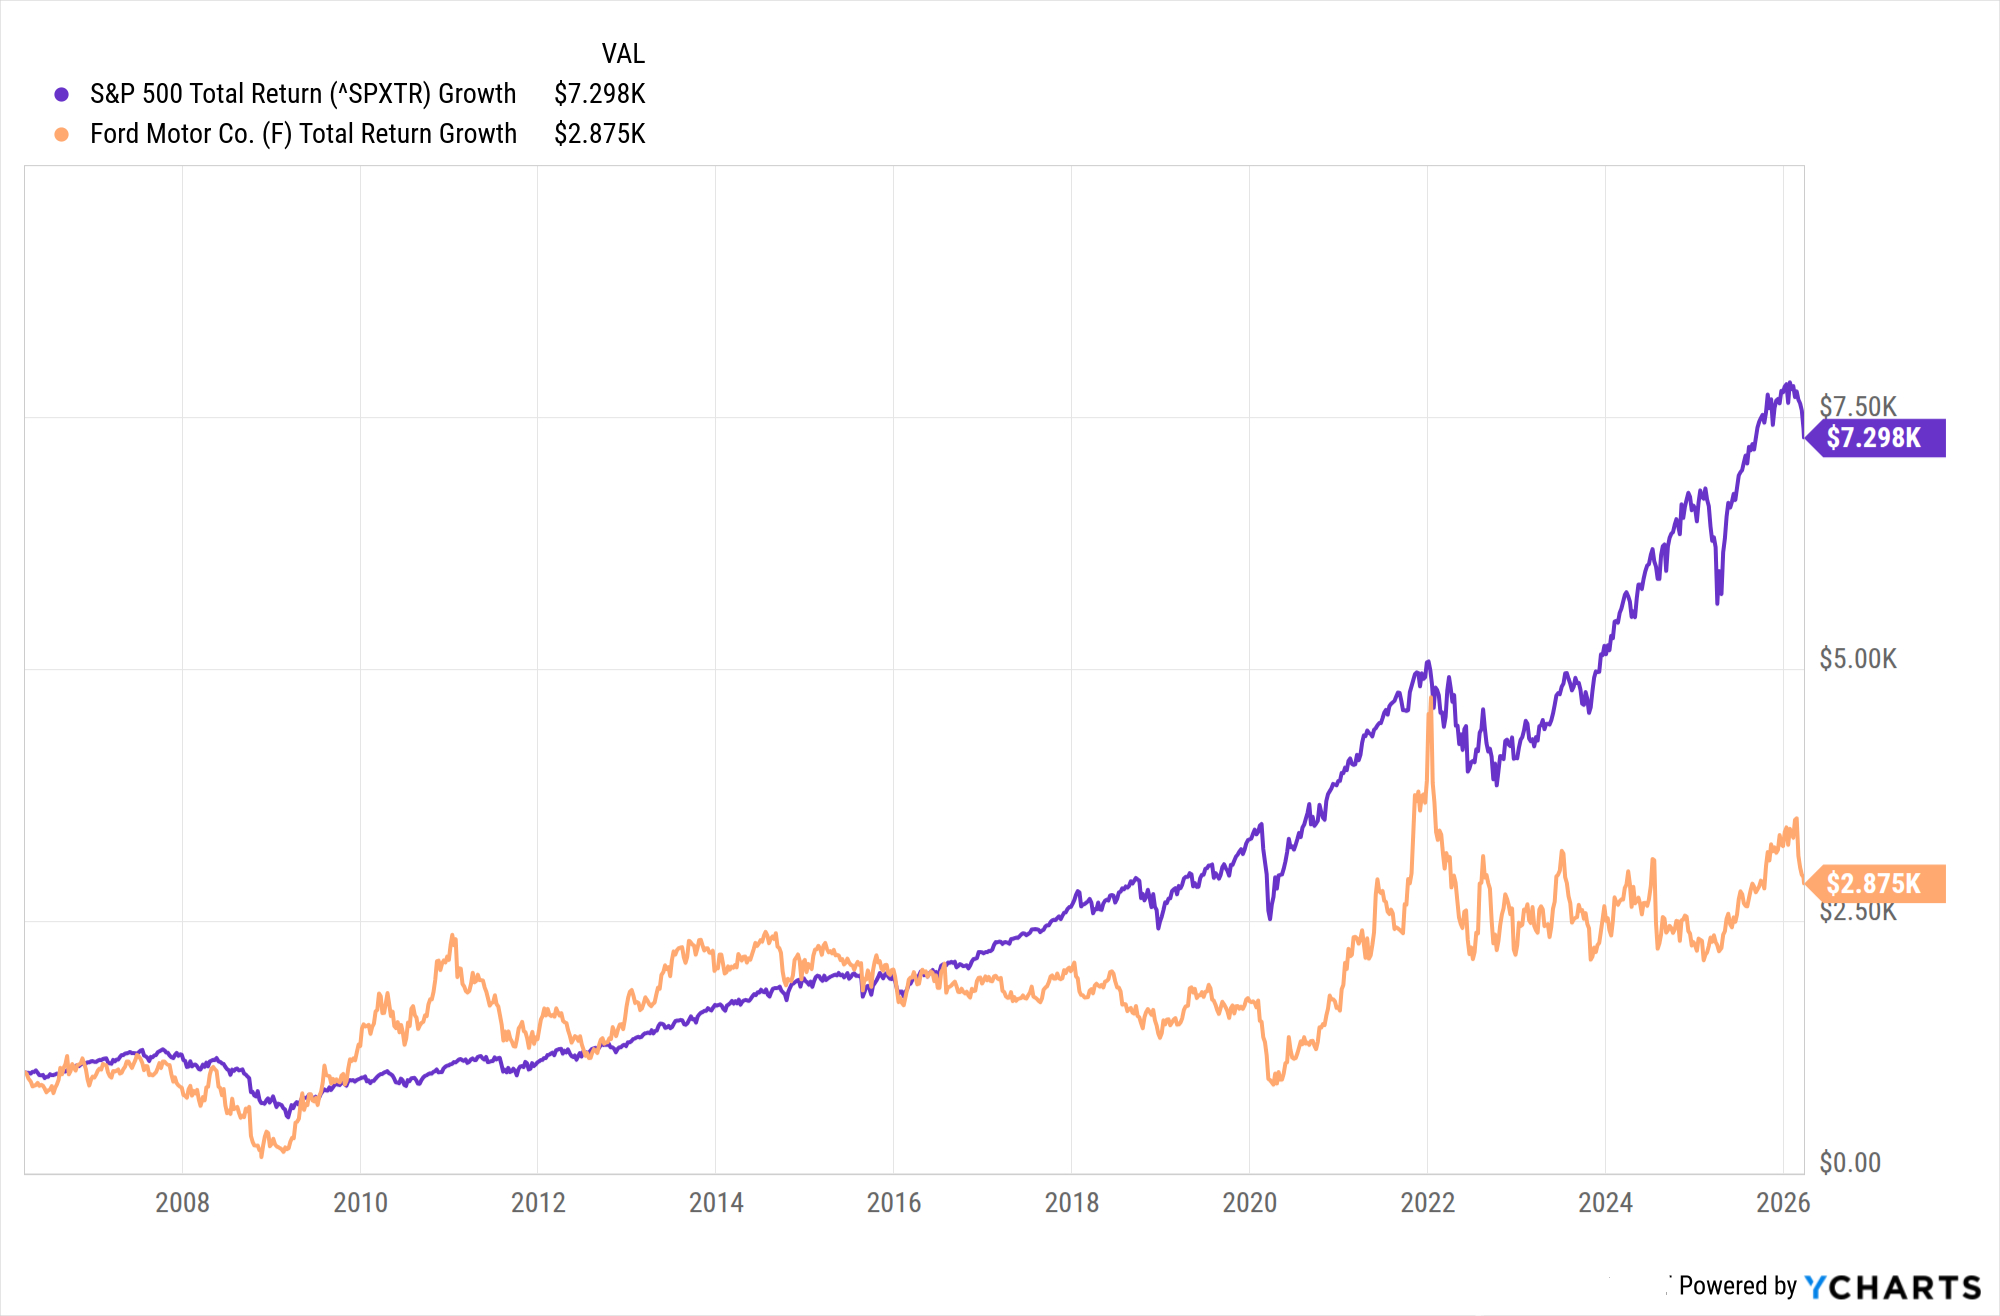
- Annualized Returns: Ford’s 5.4% annualized return significantly underperforms the S&P 500’s 10.5% over the same two-decade period.
- Dividend Profile: The company currently offers a robust dividend yield typically ranging between 3.4% and 5.6%, acting as a primary draw for income-focused investors.
- Segment Profitability: Ford Pro (commercial) remains the strongest profit engine, while the Model e electric vehicle division projects losses exceeding $4 billion.
- Financial Position: Ford maintains high leverage with a debt-to-equity ratio of 4.54 and total debt surpassing $160 billion due to its financing arm.
- 2026 EBIT Guidance: Management projects an adjusted EBIT between $8 billion and $10 billion with free cash flow of $5 billion to $6 billion.
An investment of $1,000 in Ford stock 20 years ago would be worth approximately $2,900 today, representing an annualized total return of 5.4% including dividends. While this highlights consistent Ford stock returns, it significantly lags the S&P 500's performance over the same period, which would have turned that same $1,000 into roughly $7,300.

Historical Performance: The $1,000 Case Study
When analyzing Ford stock returns over the last two decades, one must separate simple price appreciation from total return. Looking at the raw price, Ford has often traded in a frustratingly horizontal band. However, for the long-term holder, the combination of dividends and the eventual recovery from the Great Recession paints a more nuanced picture of Ford stock total return history.
Comparing the Ford vs S&P 500 performance reveals a stark reality of the legacy automotive sector. Even though Ford successfully navigated the 2008 financial crisis without a federal bailout—unlike its Detroit peers—its equity performance struggled to keep pace with the broader market's secular bull run driven by technology and secular growth. During the depths of the 2008 financial crisis, Ford's stock reached a low point where it traded for less than $2.00 per share, representing a peak-to-trough decline of more than 75%.
The dividends that many investors rely on were not always a constant. Ford suspended its regular quarterly dividend payments in 2006 due to financial restructuring and the onset of the global financial crisis, and did not resume them until 2012. This gap in payment significantly impacted the Ford stock 20 year total return vs S&P 500 results, as the power of compounding was hindered during a critical era of market recovery. By late May 2026, the data showed that Ford Motor Company's 20-year total return, including reinvested dividends, reached 392.93%. This results in a compound annual growth rate of approximately 8.3%, though different entry points within those 20 years fluctuate the final result closer to the 5.4% to 8% range depending on specific month-to-month volatility.
| Metric (20-Year Horizon) | Ford Motor Co. | S&P 500 Index | Industrial Sector Avg |
|---|---|---|---|
| Ending Value of $1,000 | ~$2,900 | ~$7,300 | ~$4,800 |
| Annualized Total Return | 5.4% - 8.3% | 10.5% | 7.9% |
| Dividend Consistency | Suspended 2006-2012 | High | Moderate-High |
| Max Drawdown | >75% (2008) | ~50% (2008) | ~55% (2008) |
Ultimately, for those asking is Ford stock a good buy for income investors, history suggests that entry price is paramount. Those who bought during the restructuring phases or the 2008 lows saw exceptional returns, while those who bought during the peak of the internal combustion engine era have seen much of their capital gains erased by inflation and sector-wide valuation compression.
Structural Shift: Ford Blue, Pro, and Model e
To understand the Ford stock investment outlook, investors must stop viewing the company as a monolithic car manufacturer. In March 2022, CEO Jim Farley pivoted the organizational structure into three distinct pillars. This move was designed to high-light where money is being made and where it is being invested for the future.
Ford Blue division
This is the traditional heart of the company, focusing on gas-powered and hybrid vehicles like the F-150 and the Bronco. It remains a massive generator of cash, providing the necessary liquidity to fund the broader legacy automaker transition. For investors, Ford Blue represents the present valuation, driven by high margins on trucks and SUVs.
Ford Pro business
Often overlooked by retail investors, the Ford Pro business is arguably the most valuable asset in the portfolio. This division focuses on commercial customers, providing not just vans and trucks but also software, telematics, and fleet management services. The margins here are significantly higher than the consumer retail business, and the recurring revenue from software services provides a valuation floor that Ford has lacked historically.
Model e segment
This is the controversial front of the company's future. The Model e segment handles electric vehicle development. Currently, this division is a capital sink, with losses often exceeding $4 billion annually as the company scales production and battles a cooling EV market. The success of the Ford EV segment restructuring vs Ford Pro profitability is the central tension for the stock’s performance through 2026. If Model e can reduce its burn rate while Ford Pro continues its double-digit growth, the stock could finally break out of its multi-year range.
Financial Health: Debt, Dividends, and Dividends
Fundamental analysis of Ford requires a comfort with massive numbers. The company carries over $160 billion in total debt, though it is vital to distinguish between automotive debt and Ford Credit financing. Most of this debt belongs to Ford Credit, which operates essentially like a bank, financing vehicle purchases for customers and dealers. While this creates a high debt-to-equity ratio of 4.54, it is a standard structure for legacy manufacturers with captive finance arms.
However, the "self-inflicted wounds" have been more damaging than the debt itself. Ford has struggled with exceptionally high warranty and recall costs over the past several inflation-heavy years. These costs directly eat into the free cash flow generation that would otherwise be used for share buybacks or increased dividends. Analyzing Ford stock dividend impact on total returns shows that without the current 4% to 5% yield, investors would have very little incentive to hold the stock through the current volatility.
The market currently views the high dividend as "payment for patience." As Ford navigates the capital-intensive operations of building new battery plants while maintaining its ICE (internal combustion engine) dominance, the dividend remains the primary mechanism for total real returns. Investors should monitor Ford stock valuation metrics and 2026 EBIT guidance closely, as any threat to the free cash flow would jeopardize the payout and likely cause a significant re-rating of the share price.
2026 Outlook: Analyst Price Targets and EBIT Guidance
As we look toward 2026, the investment thesis for Ford rests on a "balancing act." Management has provided constructive guidance for the mid-decade mark, aiming for an adjusted EBIT of $8 billion to $10 billion. This target assumes that the hybrid market continues to bridge the gap for consumers who are not yet ready for full electrification.
Free cash flow generation is expected to remain healthy at $5 billion to $6 billion, which should comfortably cover the dividend. The Ford stock outlook 2026 based on analyst price targets remains split. Bulls point to the untapped value of the Pro business and the potential for price appreciation if EV losses narrow. Bears point to the rising competition from Chinese manufacturers, potential steel and aluminum tariffs, and the heavy burden of labor costs.
Bull vs. Bear Case Summary
| The Bull Case | The Bear Case |
|---|---|
| Ford Pro software margins expand beyond hardware sales. | Model e losses continue to exceed $4 billion annually. |
| Hybrid demand peaks as a more profitable alternative to EVs. | High debt-to-equity ratio restricts R&D spending. |
| Consistent dividend yield of 3.4% - 5.6% attracts value funds. | Ongoing recall and warranty costs erode cash flow. |
| Market capitalization currently trades at a low price-to-earnings multiple. | Macroeconomic tariffs on raw materials increase unit costs. |
Current analyst price targets for 2026 reflect this uncertainty, ranging from a bearish $7.00 to a bullish $16.50 per share. For the patient long-term investor, Ford remains a play on the survival and modernization of American industry. It is not a high-growth tech stock, but a high-yield industrial giant in the midst of a massive structural renovation.
FAQ
What is the average annual return of Ford stock?
Over the last 20 years, the annualized total return for Ford stock has been approximately 5.4% to 8.3% when dividends are reinvested. The variation depends on the specific starting and ending periods, as the stock has experienced significant volatility between market cycles.
How much would $1,000 invested in Ford 10 years ago be worth today?
A $1,000 investment 10 years ago would be worth roughly $1,350 to $1,500 today, including dividends. This relatively stagnant growth highlights the challenges Ford has faced in transitioning its business model during a decade where the S&P 500 saw triple-digit gains.
Is Ford stock a good long-term investment?
Ford is often considered a "value" or "income" play rather than a growth investment. It may be suitable for long-term investors who prioritize high quarterly dividends and want exposure to the commercial vehicle sector through Ford Pro, but it carries higher risk due to its high debt levels and the costly transition to electric vehicles.
How does Ford's stock return compare to the S&P 500?
Ford has significantly underperformed the S&P 500 over the long term. While the S&P 500 averaged a 10.5% annual return over the last 20 years, Ford’s return was closer to 5.4%. This gap is largely due to the capital-intensive nature of the automotive industry compared to the high-margin technology firms that dominate the S&P 500.
What are the risks of investing in Ford stock?
The primary risks include high capital expenditure requirements for the Model e division, potential dividend cuts if free cash flow drops, high debt-to-equity ratios, and "self-inflicted" costs from vehicle recalls. Additionally, the automotive sector is highly cyclical and sensitive to interest rates and global trade policies.